Where are we, where do we have to go? The countdown is running:
| global warming | remaining CO2-Budget 2020 | reached in * assuming constant emissions of 42Gt/yr
|
|---|---|---|
| 1.5 ° | 380 Gt | 2028 |
| 2 ° | 1170 Gt | 2046 |
*= 1.5° could be reached a little later than 2028. But then, 1.5° C cannot be prevented anymore, even if we stop emissions all of a sudden.
A full global energy transition is required within 10 to 20 years1 to avoid the uncontrollable scenarios which the IPCC predicts for global warming levels beyond 1.5 °C. Against this background, it is surprising that international concepts are hardly discussed. In the Paris Agreement of 2015, many countries only promise to set goals for themselves. That was the lowest common denominator and was already celebrated as a milestone. But the implementation remains vague. There are appeals by the international energy acency IRENA to install more wind turbines and photovoltaics (PV). But when it comes to the question how to deal with the massive fluctuation of these renewable energy sources, the large-scale deployment of storage and power line networks remains postponed to later decades, if part of the concept at all. Politicians seem to lack any vision.
This site is intended to clarify the orders of magnitude : How much wind and PV would be required to supply the world with 100% renewable energy in all sectors? A global network with low-loss HVDC transmission lines could supply wind and solar energy from all parts of the world. Why is this approach not widely discussed? Once green energies are installed at large scale, there will not be any need to limit consumption anymore. So is there any chance to stay under the 1.5 degree limit?
The realistic answer is: No. At least not without large-scale Carbon Capture and Storage (CCS) which is controversiial (see below) and risky. But this is a red herring and should be avoided. International processes are too slow. However, this is an unprecedented situation. In theory, it is still possible to stop climate change. If this does not succeed, feedback processes will start . Droughts, extreme weather, species extinction and the rise in sea level, ocean acidification and the loss of parts of the food chain will cause much suffering and cause extreme costs. Most actors have not yet grasped the need for a radical change in policy. The worldwide expansion of PV, wind and high-voltage cables would have to reach a multiple2 of the current level for the next 20 years in order to solve the tasks.
This comes along with a second mammoth task: the electrification of traffic and heat. Energy hunger increases, especially in the main consumer countries USA, China, India and many emerging regions. A key question for the trillion investments: local storage, hydrogen import or long distance power connections? With the new possibilities of intercontinental HVDC lines and the rapid fall in the price of PV systems, affordable technology is available today while we would lose precious years if waited for the price drop of hydrogen.
¹ The IPCC calculation assumes a linear increase: 1500 Gt CO2 corresponds to a 1°C increase. But there are many factors that lead to uncertainties. The tilting temperature cannot be quantified exactly. The IPCC had adjusted the values in 2018. With a lot of luck, the climate will change a little later - maybe that's the only chance to stop the process. That does not change the drama.
² according to the rough calculations on this page by factor 10 to 20 worldwide - depending on the storage concept
2 degrees - is it already too late?
No. But it requires a radical drop in CO2 consumption per capita in the industrialised countries until 2025. Unfortunately things are moving in the opposite direction. Beyond 2 degrees, the risk of irreversible chain reactions increases. The IPCC is now estimating that 2 degrees are already too much.
The new limit is 1.5°C. Check out the IPCC special report (SR15) from 2018.
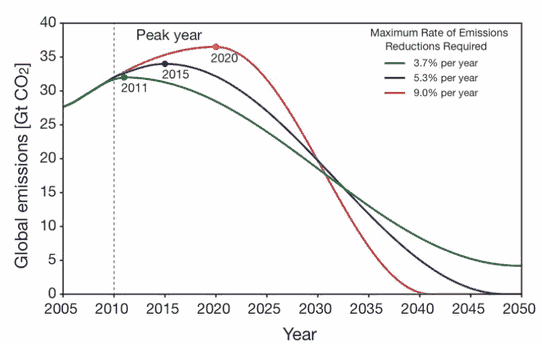
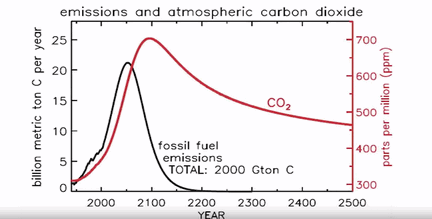
published by the Climate Change Research Centre of the University of New South Wales
showing emissions pathways to give 67% chance of limiting global warming to 2°C.
This is from a 2010 perspective. In 2019, emissions were at 43 Gt, still increasing.
Key dimensions
| electricity | primary energy (all energy) electricity, transport, buildings, industry | |
|---|---|---|
| Average global consumption (continous) | 3 TW | 18 TW |
| Space needed for 100% PV (total area, not only modules) | 400 x 400 km | 1000 x 1000 km |
World energy consumption constantly growing through the 2010s
The term primary energy combines electricity, heat and transport. In order to become CO 2 -free, all three sectors have to be replaced by renewable energies.
The global energy consumption was 161,000 TWh in 2018 (TPES= Total Primary Energy Supply).
This corresponds to a global continuous consumption of 18 TW or around 21 MWh per person per year or 2.4 kW constant consumption per person - about 20 times more than the private electricity consumption in your own household in an industrialised country. Heating, transport and consumer goods (produced elsewhere) play a significant role. In 2020, Covid has stopped the increase but only temporarily.
Consumption by regions
The hunger for energy is growing, especially in Asia (yellow).
Production by energy sources
Gas, oil and coal have grown significantly. At 10000: the low proportion of renewables and hydropower.
How much energy would renewables currently have to generate in a global energy transition?
The primary energy contains the high losses, e.g. arise when converting coal or gas into electricity. According to the IEA, the actual amount of energy consumed is significantly lower at 113,000 TWh (TFC = Total Final Consumption). Even this contains the full energy content of gasoline, from which less than half is used to move the vehicle (the rest is heat).
| TFC by sector 2017 | TWh worldwide | % of 113 TWh |
|---|---|---|
| transport | 32,650 | 28% |
| Industry | 32,800 | 29% |
| households and other | 37,320 | 33% |
| non-energetic use | 10,220 | 9% |
Electricity accounts for 25,260 TWh (22% of TFC) and is distributed across the three main sectors. 4,080 TWh are attributed to hydropower (16% of the electricity, IEA). Wind energy accounts for 1,270 TWh (approx. 5% of the electricity, BP for 2018). PV accounts for 585 TWh (2.3% of electricity, BP for 2018).
The efficiency aspect: The primary energy demand decreases automatically when fossil fuel in electricity production is substituted by wind and solar energy. This is due to efficiency. 3 KWh of fossil fuel primary energy are needed for 1 KWh electricity output. Without a heat concept, the remainder ist lost.
With a complete switch to electromobility (90% efficiency instead of 30%) with regenerative sources, the total demand would decrease further.
More efficient heating systems (heat pumps) and better insulation offer further potential in the medium term. On the other hand, there are high losses if wind and PV are not used immediately, but have to be stored as power-to-X for dark and windless periods. With a powerful global energy grid, on the other hand, there is an opportunity to limit requirements to approximately 90,000 TWh.
So the goal is to generate around 90,000 TWh per year maily with wind and solar PV.
- So the task is:
- Generate 90,000 TWh with renewables
- electrify transport and heat
- and install some storage
Renewables lag behind
Unfortunately, more than three times as much fossil energy is being installed as renewable energy (based on net generation). The bar is getting longer, while wind, PV and hydro only increase slightly. The result: CO 2 emissions increase.
| Total increase 2018 | Gesamt | renewables (excl hydro) | hydropower |
|---|---|---|---|
| TWh | 4560 | 760 | 328 |
China, the United States and India are primarily responsible for the growth of world primary energy needs.
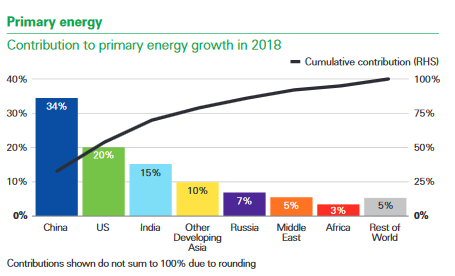
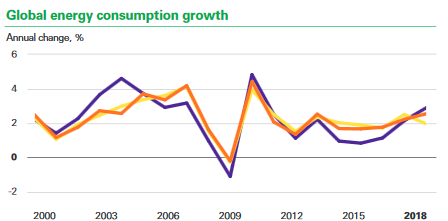
More CO2 - die driving factors
- 2/3 of the growth was caused by China, India and the USA
- 1/4 of the growth in the USA, Russia and China due to extreme weather - during heat waves, air conditioning systems are turned on
- In 2018 gas production rose by 5% worldwide, half of it in the USA, further increases in Russia and China
- The United States produced significantly more oil and gas: 2018's biggest ever increase in any country
- China relies on gas: + 33% in 2 years
- China and India are building new coal-fired power plants
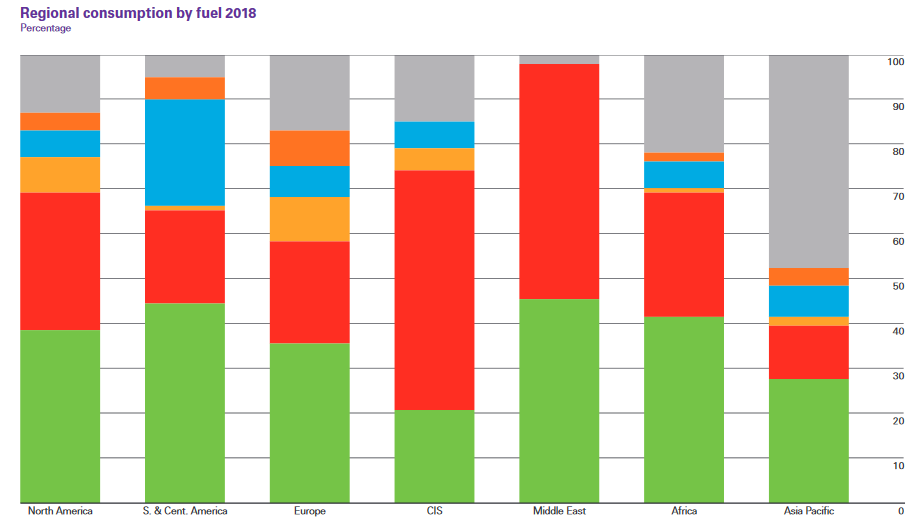
Renewable energies have only played a significant role in Europe, Asia and North America. However, these are also the largest consumers. Striking: The high proportion of coal in Asia

Forest fires
According to Greenpeace, fires caused 8 Gt of CO2 emissions in 2018. That would account for 20% of all global emissions. CO2 would only be bound again if they were completely afforested. Large regions were on fire particularly in Brazil, Congo, Angola, Australia and Siberia.
Plastic
Plastics cause CO2 emissions with some lag when they are burnt as waste and - in the best case - are "thermally recycled". On the other hand a lot of plastic ends up in the environment. According to BP (p.32) , the oil requirement for plastic production in 2017 was 15 million barrels a day, i.e. 871 billion liters of oil a year. A combustion of all plastic would therefore correspond to approx. 8,000 TWh of primary energy. If you assume more than 2 kg of CO2 per liter of oil , you end up with around 2 Gt of CO2 per year, or about 5% of the world's emissions.
Long-term development
The BP Energy Outlook 2019 expects significantly growing demand, especially from India and China. On the other hand, e-cars and heat pumps can roughly reduce primary energy requirements by 30% because they work more efficiently.
Efficiency gains in transportation
E-cars are by far the most efficient. This would cut the energy requirement in half. If all cars and trucks were already electrified, the world energy requirement would be approx. 10% lower. However, this would rise again as soon as more inefficient hydrogen prevails as a fuel. The use of hydrogen only makes sense if it is produced with RE (see below).
| Fuel type | efficiency in vehicles |
|---|---|
| Petrol | 22 % |
| Diesel | 25 % |
| Hydrogen | 30 % |
| Electricity (battery) | 76 % |
Efficiency gains through heat pumps
Efficiency increases by a factor of 2.8 (air), 4 (earth) to 4.8 (water), depending on the system. The values for hot water are somewhat lower. In most cases only air is available. With a complete changeover, the global consumption of primary energy would be 20% lower. The first priority would be a better thermal isolation though.
Local energy storage, global grid expansion or hydrogen transport?
Wind and sun are volatile. There are three ways to compensate for this:- Global grid expansion (HVDC): Continous energy is available if PV and wind plants are distributed and connected over very large areas. The interconnection of continents with a multi-terminal supergrid requires intensive political cooperation and implies new international dependencies.
- Local storage: Large batteries are not enough. It would require conversion to methane or hydrogen and storage in the natural gas network, which is not available everywhere. Reconversation to electricity results in high losses. Pumped hydro (PHES) and compressed air energy storage (CAES) are alternatives in some regions.
- Hydrogen from the deserts: Could be produced instantly, but not yet in the required scale. This is the path of least resistance. Hydrogen could be shipped easily around the wirld. The disadvantage: high efficiency losses and more power plants required and thus a higher energy price.
Storage means loss and requires the two or threefold amount of wind energy or PV. Continental grids are more efficient. The right balance of storage and grids must be found.
Key Question: Energy storage or power lines?
There must be a balance of...
| power grids | storage |
|---|---|
|
(+) low loss
(+) probably cheaper (+) installation in remote areas: no conflicts, cheap land (-) international dependencies |
(-) Power-To-X: 60% loss (after reconversaion)
(-) batteries: expensive and not available in required dimensions (+) energy autonomy for countries (+) support regional economy if investors are local |
An intercontinental power grid is probably the cheapest solution for a global energy transition.
A single cable can carry up to 12 GW today. A few 100s of these between continents would decrease storage requirements significantly. China has built such a connection over more than 3000 km. The country has also initiated the GEIDCO organisation promoting a global power grid for the distribution of renewable energy. It seems to be the only initiative of that kind. But it must be mentioned that at the same time China is largely responsible for the increased exploitation of large coal reserves, just like India, the USA and Australia.
Local storage
The smaller the network region, the greater the required storage capacity. The fluctuations of wind and sun cannot be compensated if the region is isolated.
Nevertheless, it sounds easier to complete a energy transition in single countries for a start. Showing that 100
% RE is possible. International negotiations about a global master plan would take much precious time. Why not start locally?
The disadvantage: Conversion into methane/hydrogen (P2X) and reconversion into electricity are not efficient. More than half of the energy is lost. Investments into electrolysis and reconversion plants cause additional costs, depending on the storage time (minutes to months) and the number of discharges and the associated conversion technology. A study by Imperial College London tried to predict the development:
Small network = Large storage ... Large network = Small storage
| duration | Cost 2020 US¢/KWh | Cheapest technology 2020 | Cost 2050 US¢/KWh | Technology 2050 |
|---|---|---|---|---|
| longer periods without wind and sun ("Peaker Replacement") | 10 | PHES 80%, CAES 20% | 6 | LiON 80%, Redox-Flow 20% |
| Seasonal Storage | 32 | CAES 40%, PHES 25%, Hydrogen 22% | 13 | Hydrogen 80%, CAES 10%, PHES 10% |
Efficiency of long-term electricity storage (conversion and reconversion)
| technology | efficiency (without heat concept) | |
|---|---|---|
| Methane (P2G Power-To-Gas) | 35% | |
| Hydrogen (P2H) | ca 40% | |
| PHES Pumped Hydro | 75% | limited reserves |
| CAES Compressed Air | 40 - 50 % | short term up to 70% |
| Battery LiON | 70-90% | |
| Battery RedOx Flow | 70-90% | |
| Battery lead (Pb) | 80-85% |
Various types of batteries, compressed air, capacitors and even flywheels are suitable for short-term storage in order to flatten power peaks in the grid.
Electric cars can also serve as electricity storage. However, once the power is used up, they would then no longer be able to drive. With 40 million electric cars with 50 KWh there are 2 TWh and thus the primary energy requirement for 4 days or the current electricity requirement for one month in Germany.
Flexible electricity prices (hourly or even in 15 min intervals) for all consumers could be another option to adjust supply and demand. Smart-meters should be prepared for this. Unfortunately, the devices which are currently installed on a large scale lack this ability far too often.
Enough capacity for hydrogen storage
Accordning to the study Technical potential of salt caverns for hydrogen storage in Europe, Europe alone has a capability of 85 PWh for hydrogen - corresponding to about half a year of the world's primary energy demand. However, security and leakage issues have to be considered. And green hydrogen production is light years away from these amounts.The Supergrid
The sun is always shining somewhere. And the wind always blows somewhere. Could the problem be solved by expanding long power lines instead of storing them? The losses are acceptable:
| Overhead 380 kV AC | HVDC 1200 KV | |
|---|---|---|
| loss per 1000 km | 10 % | 1.6 % |
Converters cause additional losses on a low scale. But still, HVDC is superior to power-to-gas conversion and backflow.
Single continents or worldwide?
- An isolated European or North-American supergrid would still rely on large storage facilities or gas-fired power plants, which could step in if there was not enough wind at night.
- If PV and wind turbines were linked globally, this would deliver a constant base load. A multi-terminal network minimizes political risks.
- In deserts or inhabited areas, inexpensive PV installation is possible. Russia, China, Saudi Arabia, Australia and the USA - countries pushing fossil fuels today - have a great potential for RE. It would be economically attractive for these countries to continue exporting energy - in this case PV and wind instead of gas and oil.
- HVDC under the sea is more complex and expensive (currently only max 2 GW per cable, max 2000m depth). But finding a route is easier.
- In any supergrid the role of nuclear and fossil energy must be negociated. Global interconnections require global standards for carbon taxing.
China's approach to a global supergrid
China is currently the only country pursuing the approach of an international supergrid. The Global Energy Interconnection Development and Cooperation Organization GEIDCO was established in 2010. According to this map, the main focus is on land-bound links.
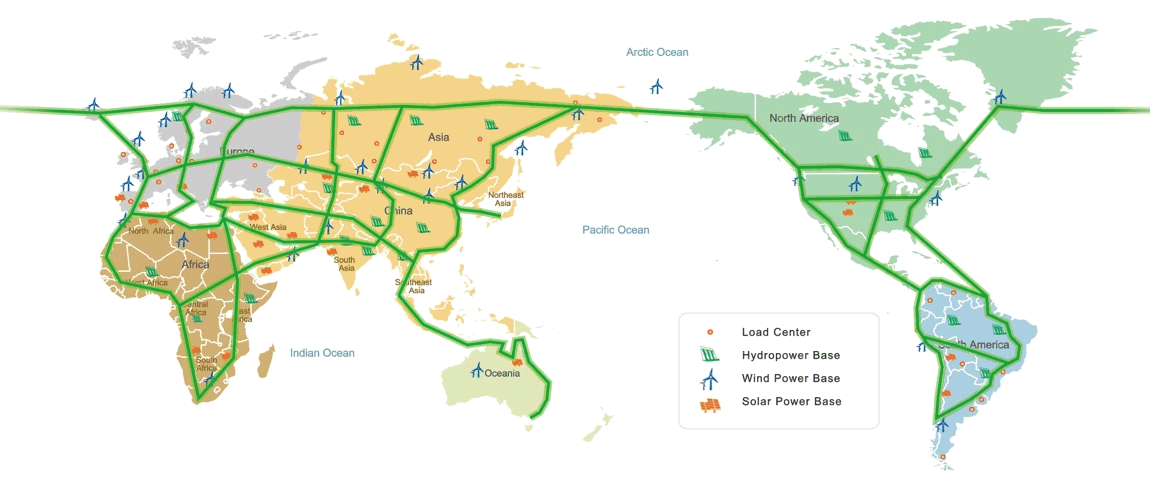
The plans, which are also connected to the Belt and Road initiative, seem to have high priority. President Xi Jinping mentioned the idea at the COP in Paris 2015. The former president of the State Grid Company of China (SGCC) Liu Zhenya is chairman of GEIDCO. The first steps are evidently the supply of electric energy in Africa and Brazil in combination with the installation of fossil and RE power plants. But China is also missing out on Europe: When Portugal was forced to sell the state's energy grid as a result of the financial crisis, China secured a 21% share. In 2018, the Financial Times reported on China's efforts to gain influence in the international electricity market. Little has been reported about this strategy in Europe. A study by the EU Commission's Joint Research Center examined possible routes for a connection between China and Europe in 2018, reports on individual projects worldwide and shows the state of development. The same team of authors (Ardelean, Minnebo) published a study about the potential a HVDC link between Europe and North America.
GEIDCO targets for the global supergrid
| year | power | north-south west-east backbones |
|---|---|---|
| 2035 | 280 GW | 5 |
| 2050 | 720 GW | 7 |
| 2070 | 1250 GW | 9 |
GEIDCO forecast for electricity demand in 2050: 73,000 TWh of which 15,000 TWh cross-border according to Zhenya's presentation (18:15)
However, the 1.2 terawatts by 2070 correspond to "only" one third of today's electricity consumption and only 7% of primary energy consumption. And 2070 is far too late. Still, it appears to be the only global plan. China has already built a 3300km link (UHVDC) with 12 GW across the country from west to east. SGCC states that 5000 km are already conceivable. However, the goal is also to make greater use of the coal reserves in Xinjiang (in NW) in order to limit air pollution in the centers in the SE. At least China also sees a potential for 200 GW of renewable energies in the NW. GEIDCO provides some estimations for 2050:
- Goal: 83% renewable energies in a largely electrified world
- Average electrical consumption increases to 6,200 KWh per year per capita
- Cost: $ 38 trillion for the complete global energy transition, including $ 390 billion for the intercontinental HVDC grid
- US $ 1.8 trillion in annual energy savings The total of 38 trillion is in line with the IEA's estimates for necessary investments by 2035. For comparison: $ 11 trillion would also have to be invested in oil and gas in the coming years to meet the demand according to the United Arab Emirates government.
What happened to Desertec?
The industrial project Dii (Desertec Industrial Initiative, now Dii Desertenergy), which started in 2009, aimed to generate 1000 TWh per year with huge PV and CSP systems in the North African Sahara with HVDC links. This should cover around 15% of European electricity needs. An investment of € 400 billion was given as rough estimate. There was controversy over the question of whether the countries' own needs should be covered first. Many European companies have quit. The main players are now the Saudi Arabian ACWA, China's State Grid SGCC and the German Innogy.
The Desertec Foundation exists independently as an NGO working towards global solutions for the energy question. The focus is on the energy potential of desert regions with PV and Power-To-X. The organization is affiliated with the Club of Rome. Another initiative under French leadership was Medgrid, formerly Transgreen, which apparently fell asleep. The approach was smaller than that of DII: Individual HVDC links from North Africa for around € 40 billion. No updates on their website since 2015.
HVDC costs
Overhead links are cheaper than underground or sea cables. But apart from that costs per km and GW vary strongly. Here a look at a few projects:
| project cost | totel | length | power | voltage | type | per km and GW |
|---|---|---|---|---|---|---|
| Changji-Guquan (China) | 40,7 Bn Yuan | 3293 km | 12 GW | 1100 kV | overhead | 100.000 € |
| Nordlink (Germany-Norway) | 1,5 - 2 Bn € | 623 km | 1,4 GW | 800 KV | combination (53km overhead/516km sea/54km underground) | 1,7 - 2,3 Mio € |
| USA study by EIA | - | - | - | - | - | 1,3 - 3 Mio € |
- Rough calculation for a cheap, powerful global supergrid: € 36 trillion or the global gross national product of half a year. (40,000 km with 9 TW which is half the current worldwide continuous consumption of primary energy. Calculated with the best-case € 100,000 per km and GW (China). This sum could presumably be reduced by mass production and improvement of the technology as soon as there is a corresponding demand.
- USA: Estimated cost of an underground supergrid for the USA : less than US $ 500 billion (p.11). For comparison: today's network costs are US $ 25 billion per year.
- These are investments that are being refinanced. If you set up the Chinese HVDC manufacturing costs, a 10,000 km cable would have refinanced itself after 5 years with a network charge of only 2ct / KWh. The network charges within Germany are currently significantly higher, at times more than 10 cents.
Underground cables more robust against electromagnetic shocks
Electromagnetic storms caused by cosmic events or special bombs can cause blackouts and the destruction of the electricity infrastructure over a large area. In order to reduce vulnerability, the USA study recommends shielding or even undergrounding the HVDC links (p.11).
Hydrogen from the desert
The difficulties in building HVDC lines can be avoided by using hydrogen which can be shipped anywhere. The German government estimates the demand for Europe in 2030 is 665 TWh and thus 1% of the primary energy demand. By 2050, 70% of cars could run on hydrogen. However, the use of hydrogen comes along with high energy losses. The result: Three times larger capacities for wind / PV are required. Shipping of hydrogen would have to be carbon-free, too.
100% model calculations
The following rough calculations are only intended to get a clue of the potential of wind and PV. Only a mix of sun, wind, water and storage systems would make sense. It is also difficult to estimate the future demand for primary energy (especially with the losses for conversion and storage). The calculations simply use today's values to illustrate the dimensions.
100% PV with a global supergrid
The solar potential ranges from around 500 kWh (polar region) to 2500 kWh (equator) per year and KWp (installed power).
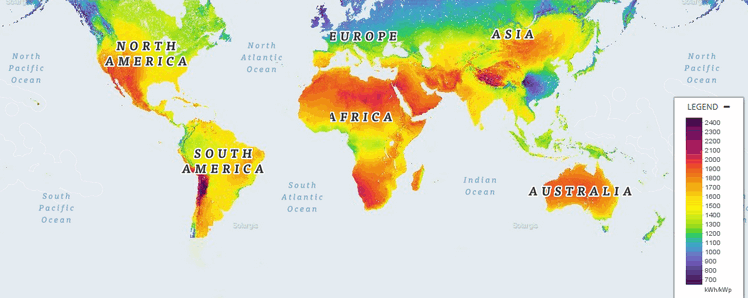
The energy yield ranges from around 500 kWh (polar region) to 2500 kWh (equator) per year and installed capacity (KWp). For house systems about 6 m2 per KWp (installed capacity) are required. At an average location with 1500 KWh/KWp this results in 250 KWh/m2 (per year).
However, in large PV power plants the modules cannot be installed gapless. Some space is needed for maintenance of the system. The list of the largest solar parks shows that around 40 MWp per km2 are common. This corresponds to only 40 Wp per m2 or 25 m2 per KWp. This reduces the energy yield under real conditions to 1500/25 = 60 KWh / m2 per year.
According to Fraunhofer ISE, efficiencies are now 17% for standard industrial modules and 25% for top modules.For comparison: only 1% of the solar energy reacing the ground is used in the production of electricity from energy crops. Source: Fraunhofer ISE: Current facts about photovoltaics in Germany (p.43).
In the long run, the efficiency of PV modules could be more than doubled. Helmholtz Science Center Berlin expects more than 40% by combining silicon and thin-film (tandem technology). Cost and space requirements could also be reduced by using Perowskit. These modules are currently under development.
Fraunhofer ISE states a better efficiency for land use in Germany that is almost twice as good: 1.4 a per MW (p.43), corresponding to 110 KWh / m2. The Cestas solar park in France even has 125 Wp per m2. However, the modules here are oriented to the east-west, so that the yield per installed output (KWh / KWp per year) should be significantly lower. With this method, the space requirement can be halved, but the costs increase significantly because significantly more modules are needed. This only makes sense in densely populated regions. Another advantage: an energy production at a more continous level over the day.
Gross space requirement (including gaps) for PV systems
- Only current consumption of electricity: 26000 TWh / (60 kWh / m2) = approx. 433,000 km2, 650 x 650 km, 0.3% of the world's land area. This corresponds to the area of Iraq or Sweden. Without gaps (net), the modules would cover 320 x 320 km.
- Required electricity for 100% PV: 90000 TWh / (60 kWh / m2) = approx. 1.5 million km2, 1225 x 1225 km, 1% of the world's land area. Without gaps 600 x 600 km.
- Total current primary energy: 161000 TWh / (60 kWh / m2) = approx. 2.7 million km², 1640 x 1640 km , about 1.8% of the world's land area. This corresponds to the area of Algeria or Kazakhstan. Without gaps, it would be approx. 800 x 800 km.
- With improved efficiencies, the space requirement will decrease. 1000 x 1000 km seem achievable
At 1500 KWh/KWp per year, 26,000 TWh/(1500 KWh/KWp) = 17,000 GWp would be necessary for the pure electricity requirement, and about 100,000 GWp for the primary energy, based on the current demand. 100 GWp were installed in 2017, the IEA forecasts around 700 GWp from 2020 to 2024. Even at this optimistic level, we would still need 120 or 600 years. Or: You would have to increase production capacities by 6 to 30 times to install this quantity within 20 years. The mineral resources for PV production will could become an issue.
In a global approach without minimized storage capacity, the supergrid would have to be able to transport a large part of the 18 TW which are constantly consumed on average worldwide. For comparison: Underwater cables currently have up to 2 GW, the strongest overland line 12 GW (see above). We would therefore need a global network of around 1,500 to 9,000 HVDC cables of these categories to span the globe. According to Siemens, HVDC of 100 GW was installed worldwide in 2012. A significant increase in production would also be necessary here.
Additional remark: The land use is signifigant. But many square kilometres will disappear when the sea level rises. PV panels on the surface of the sea are a new approach with a great potential.
- The advantage of PV: Easy installation
- average solar radiation in latitudes up to 40 ° N/S: 2000 KWh/(m2*a).
- produced energy per m2: 340 KWh/a
- only 5m2 are needed for 1 KWp (installed power capacity)
The table shows results for 1600 KWh/(KWp*a) and an efficiency of 17%. This value constantly increases.
A different value is 18% average output power per installed power which comes from the fact that the sun does not shine all day.
The following table uses net area values (without gaps) and calculates with 320 KWh/m2
| area | size (total worldwide) | installed power capacity | average output power (18% of installed power) | net energy per year | electricity for... (roughly) | costs (only panels, 2019 prices, rounded) |
|---|---|---|---|---|---|---|
| 1 m2 | 1m * 1 m | 200 Wp | 36 W | 320 KWh | 5 € | |
| 5 m2 | 2.2m * 2.2 m | 1 KWp | 180 W | 1600 KWh | one person | 26 € |
| 100 m2 (roof) | 10m * 10m | 20 KWp | 3.6 KW | 32 MWh | 500 € | |
| 10000 m2 (hectare) | 100m * 100m | 2 MWp | 360 KW | 3.2 GWh | village (2000 inhabitants) | 50000 € |
| 1 km2 | 1km * 1km | 200 MWp | 36 MW | 320 GWh | city (200,000 inhabitants) | 5 Mio € |
| 3000 km2 | 55 km * 55 km | 600 GWp | 108 GW | 960 TWh | double electricity Germany | 15 Bio € |
| 160.000 km2 | 400 * 400 km | 32 TWp | 5.7 TW | 51 PWh | double of global electricity | 800 Bio € |
| 1 Million km2 | 1000 * 1000 km | 200 TWp | 36 TW | 320 PWh | double of global primary energy | 5 Trillion € |
The areas would be needed for solar panels around the world. Cable and converter losses would increase demands. For this reason it makes sense to look at the "double" amounts.
This is just a model calculation. Solar power is perfect for latitudes up to 40 ° north/sound. In many coastal regions wind power would be the better choice.
Model calculation with 100% offshore wind
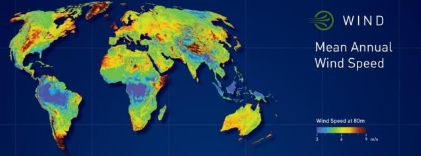
Link: IRENA Global Wind Atlas
The required supergrid capacity would probably be much smaller. In contrast to PV, the whole energy does not need to be transported around the globe. Usually some wind can be found less than 2000 km away from any place. The numbers are upscaled from statistics in Germany.
| Installed Germany 2017 | Produced Germany 2017 | Relation installed / produced | globally required for 18 TW constant power | global number of turbines a 3 MW | global area required | |
|---|---|---|---|---|---|---|
| onshore | 46 GW | 89 TWh | 22 % | 81 TW | 27 Mio | 2.7 Mio km² 1643 x 1643 km |
| oder offshore | 4 GW | 20 TWh | 62 % | 29 TW | 10 Mio | 1 Mio km² 1000 x 1000 km |
With 18 TW continous consumption worldwide, 29 TWp installed capacity on offshore or 81 TWp onshore would be needed. At 0.1 km2 per 3 MW system (330 m apart) you end up with 10 million offshore turbines that cover 1 million km2 or 27 million onshore systems covering 2.7 million km2. For offshore the space requirement would be similar to PV. Almost three times as many plants would be needed onshore. It is questionable whether the combined wind power leads to a reasonably constant power throughout Europe, for example. Here too, global networking is recommended.
Hydropower
Hydropower currently generates as much energy as wind, sun and biomass combined. The largest producers are China (3163 TWh), Canada (1020), the USA (759), India (367) and Norway (363). However, they are associated with environmental damage. Expansion scenarios are not as easy to develop as with PV and wind. There are twice as many new installations of PV and wind turbines than of hydropower.
Fossil energy reserves
Oil and gas will not run out too soon. There are still large deposits. When burned, natural gas alone would release three times the amount of the CO2 budget for two degrees. The amount of eligible reserves is increasing massively with new technologies. A main problem is to convince the owners (countries or companies) of oil / coal / gas to leave the natural resources in the ground. They are currently worth about US $ 100 trillion.
| original reserves | current reserves | CO2 when burnt | annual consumption | CO2 per year | lasts until (under current exploration level) | value (world market prices 2019) | |
|---|---|---|---|---|---|---|---|
| natural gas | 509 Gt | 183 Gt | 3640 Gt | 4 Gt | 11 Gt | ca 45 years | 18 trillion $ |
| oil | 216 Gt | 120 Gt | 4 Gt | 2 Gt(?) | 50 years | 58 trillion $ | |
| coal | 1000 Gt | 730 Gt | 2200 Gt | 6 Gt | 20 Gt | 350 years | 33 trillion $ |
coal 45$/t, oil 480$/t
A special problem is flaring: If natural gas = methane is not burned and instead reaches the atmosphere, the damage is much higher - for example, by a factor of 25. This is the case with crude oil production because natural gas comes up. Natural gas is often also flared uselessly (according to the conversion factor, this approx. 1 Gt / a natural gas becomes 2.8 Gt CO2). Further information: regenerative-zukunft.de (in German)
Carbon Capture and Storage (CCS)
With current politics, it seems illusionary to remain within the carbon budget of less than 400 GtCO2 (2020) which will probably be vanished until the end of the decade. It would still be possible to ramp up wind, solar and grids exponentially. But this does not happen. Sadly, most pathways to 1.5° in science depend on large scale CCS. This risky technique is a tranquilizer for the process. The dangerous message: There will be negative emissions some day. We can wait. Most 1.5°-scenarios (with temporary overshoot) depend on storing 10 - 20 GtCO2/y under ground (CCS p.4). Avoiding CCS and installing solar and wind energy now would be much cheaper.
CSS risks and issues
- Danger for undergound water reserves: CO2 highly comporessed acts lika an acid: It can resolve toxic substances and dispense rock formations. There is a risk of leakages
- High energy demand: 1/3 less efficiency for fossil fuels with CCS. Avoiding CO2 production is just better.
- Risk of long-term leakage
- Conflicts with geothermal applications
- Capacity could be used much better for green hydrogen or compressed air storage
CSS potential
More than 10,000 Gt worldwide, 300 Gt in Europe, most of it in Denmark, Norway, UK and Germany (CSS p.24). This would be enough for 250 years of annual emissions if all potential storage could really be used.Blue hydrogen
Is a way to produce hydrogen from fossil natural gas and capture CO2 with it. Greenpeace sees issues in low efficiency and remaining emissions of 10 to 40% CO2. However, this type of CCS does not have the potential to net remove large amounts.2 degrees ... and then?
Most projections end in 2100. But the impact on climate will remain for more 100.000 years.
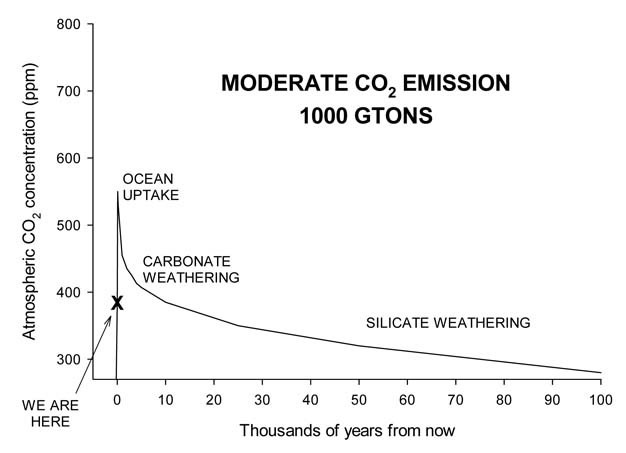
Sizes and response times of various carbon reservoirs in the carbon cycle
The oceans are the largest buffer. Much depends on the question how much CO2 can be resolved there. Even if carbon could be removed from the atmosphere, oceans would release new material.
| Inventory, Gton C | Response time | |
|---|---|---|
| Atmosphere | 700 | |
| Ocean | 38,000 | Exchanges with atmosphere in centuries |
| Land biosphere | 500 | Responds to climate in decades |
| Unfrozen soil | 15,000 | Decades |
| Permafrost soil | 400 | Melts and peat degrades over centuries |
| Ocean methane hydrates | 1,000–10,000 | Millennia or longer |
| Oil | 200 | Will be depleted in decades |
| Natural gas | 200 | Decades |
| Coal | 5,000 | A few centuries at current rates |
The warning that the climate is tilting means that irreversible processes are underway that further intensify climate change. The most popular:
- Permafrost soils release methane (significantly more harmful to the climate than CO2)
- The polar caps melt, so that the sea absorbs additional solar energy
2 degrees = 5 degrees
Global warming then progresses for a while, even if CO2 is no longer emitted at some point. This in turn can trigger further processes, so that there is a chain reaction. Time predictions are difficult because many factors influence each other. The graphic shows the temperatures at which certain climate systems fail:
There is talk of irreversibility because, i.e. Greenland's ice sheet does not rebuild on its own. Even if we had techniques to remove CO2 from the atmosphere, it would take centuries. If ocean currents change fundamentally, the current state cannot be restored . Such scenarios are likely if the global energy transition will take until 2100 or even longer. In the long term, the CO2 concentration in the air could decrease again. But the damage is irreparable.
If the fossil energy reserves are completely burned (scenario RCP8.5), forecasts by the IPCC indicate 4 to 10 degrees of global warming by 2200. Significantly higher values occur on land. The worst-case pathway leads to 2000 ppm CO2 in a Belgian study. For comparison: Indoor values of more than 800 ppm are considered as reduced quality, more than 1400 ppm as low quality. 80,000 ppm will kill anyone within one hour.
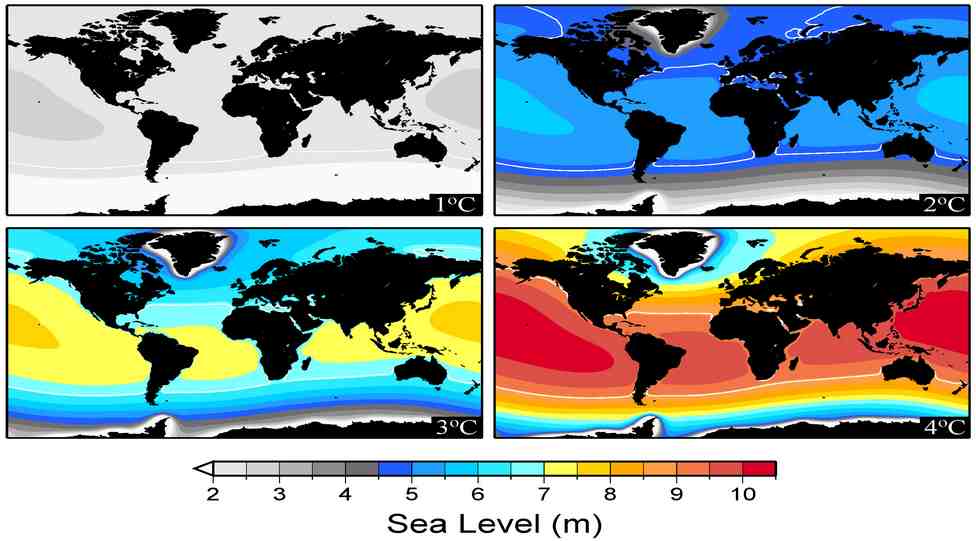
Sea level rise
- until 2100: by 20 - 60 cm
- in the upcoming 2000 years: 5 to 10 Meter, different levels in different places, 2.3 m per degree
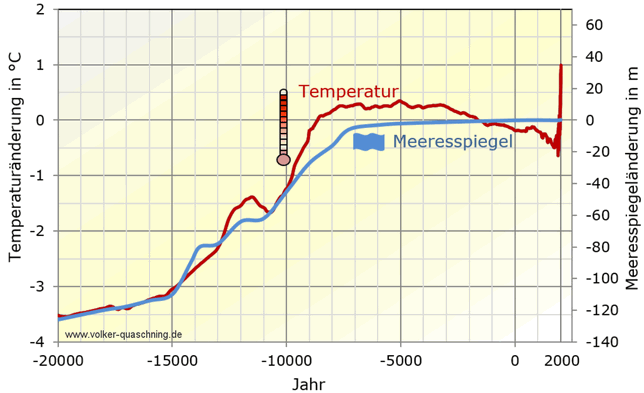
A graphic by German climate scientist Volker Quaschning showing sea levels for the past 20,000 years suggests a much higher potential: approx. 35 meters per degree. He speaks of worst case scenarios from 2.3 meters to 2100 at 4 to 5 degrees plus.
Other greenhouse gases
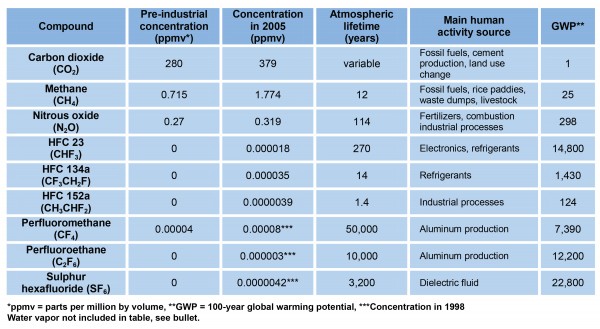
With about 80% of impact, CO2 is the main driver of climate change. Some other gases have a large global warming potential (GWP) with smaller amounts like methane from cattle by a factor of 25. This is the background of calculations with CO2 equivalents (CO2e or CO2eq). Some gases have only a short athmospheric lifetime.
Ocean Acidification
Oceans absorb CO2 and would release it again if the concentration in the atmosphere decreased. However, this leads to acidification: the pH value has already dropped from 8.18 to 8.07. This corresponds to an additional acidification of around 30%. By 2100, up to 150% will face serious biological consequences for ecosystems that have not experienced such conditions in 20 million years. The US Oceanography and Weather Agency NOAA warns of a massive reduction in mussels, corals and certain types of plankton. Their calcium carbonate structures cannot maintain under these conditions. Krill serves as the food basis for the entire marine ecosystem. The effect can already be observed around the Antarctic.
Why do we need green energy now?
Even without climate change, a global energy transition is essential. The reserves for oil and gas will fade in 50 to 100 years. The only difference: Then we would have more time. The key question: When will green energies become cheaper? The problem: Actual costs of nuclear and coal electricity are not part of their price.
Nuclear power almost without insurance
What applies to every car driver does not apply to nuclear power plants: they are not really insured against super-meltdowns. It would simply not be affordable and also difficult to organize, since the impact on health such as cancer cannot be proven as a result of the individual event.In Germany, only damages up to € 2.5 billion are covered, moreover by the assets of the energy companies, which is not sufficient. The sum calculated by insurance companies is € 6 trillion. After Chernobyl, large areas of Europe were contaminated. Even more than 30 years later there is still a restricted area 30 km around Chernobyl. It is impossible to compensate for the consequences for the damage in environment with any sum.
Storage costs for nuclear waste over one million years
The incalculable costs are simply left to the generations to come. The waste is highly radioactive. In Germany, energy companies bought themselves out with € 23 billion. The actual costs over a million years cannot be calculated reliably. It is obvious that € 23,000 euros per year will not be enough for operation and maintenance of the storage facilities.
Fossil energy: environmental damage not priced in
- It is difficult to quantify the the long-term costs of 1 t CO2 emissions. The environmental damage is irreversible.
- Health care costs , especially in countries where emissions are not filtered.
- Landscape destruction in the open coal mines, even if they are renatured at some point. In contrast, wind turbines and PV plants that can be completely dismantled.
Electricity production cost in Germany
| brown coal | oil | biomass | natural gar | Solar roofs | Solar open space | Wind onshore | ||
|---|---|---|---|---|---|---|---|---|
| net | 12-14 | 3 | ? | 9.9 | 4-6 | 10.6 | 4.3 | 4.6 |
| gross (if environmental impact and risks would be priced in) | 6730 | 24-72 | +20-59 | 17-29 | 13-33 | 12-16 | 6-10 | 5 |
In desert and remote areas, wind and solar power are even cheapet (PV down to 1.6 ct/KWh, Wind 3 ct/KWh). So wind and sun are already competitive in terms of production costs, especially when it comes to follow-up costs. Politicians often tend to slow down new installations of RE with the argument that the production of RE is too volatile. In order to deliver the right amount of energy at the right moment, costs increase. The fundamental investments in power grids and storage are therefore inevitable. Those who do not invest now, postpone spending in the future. A global carbon tax at a decent price could lead to fair market conditions. The German Umweltbundesamt suggestet a level of € 180-640 / t CO2(tendency increasing).
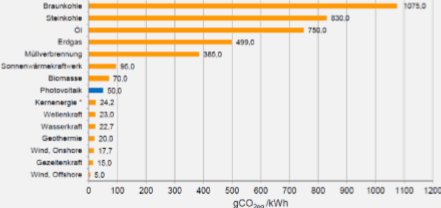
CO2 per KWh
A rough clalculation:Global emissions divided by global primary energy demand: 42*1012 kg / (161*1012 KWh ) = 260 g/KWh
Climate skepticism
The site Skeptical Science - "getting skeptical about global warming skepticism" offers an extensive collection of materials, including the disprove of around 200 climate change myths.
Fluctuations of temperature and CO2 are not unusual
That is right. But the earth has probably never gone through such drastic changes within only a couple of years.
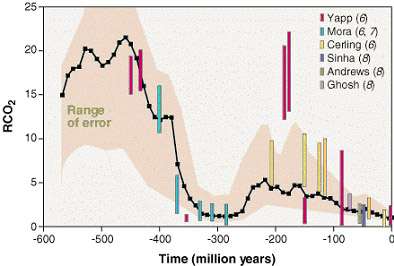
Looking at the past 400 million years, the content of CO2 in the atmosphere was often higher than now.
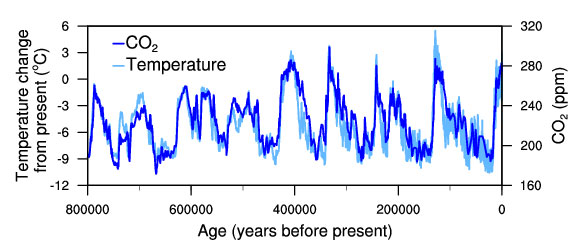
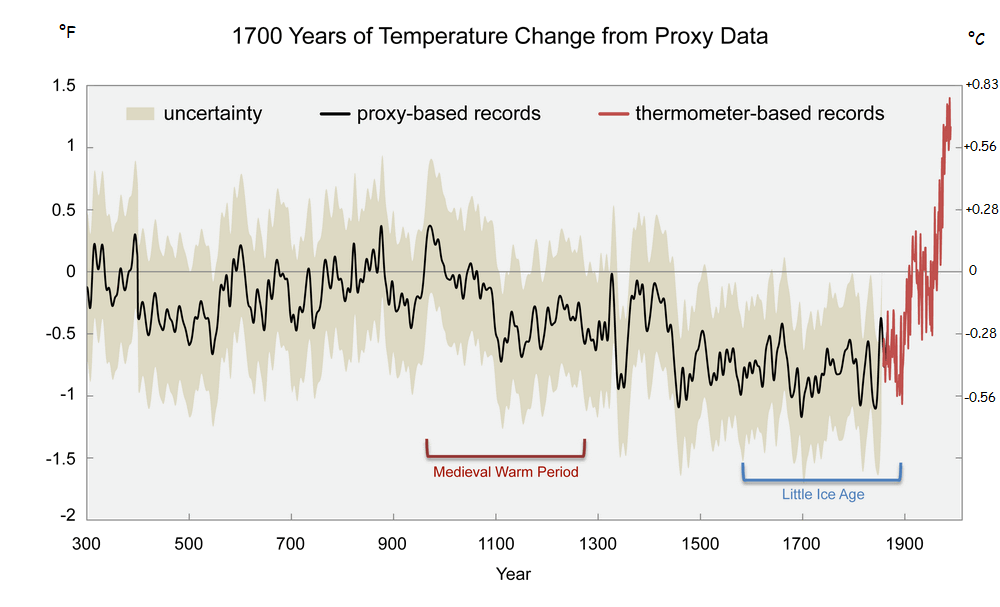
Global temperature has fluctuated around 10 ° C in the past 800,000 years. This is more than the 1.5 to 6°C that is now being discussed. But: there has never been such a rapid increase as now. In earlier times of a rapid rise, 1°C took about 1000 years. Now it has taken only 40 years. And we are already up on the scale:
Extreme weather is no evidence
Individual events are not. You have to look at it globally and over a longer period of time. And there is no doubt about the development. The temperature is just going through the ceiling. However, when the average temperature in a place rises by a few degrees, heat periods tend to occur more often. It can get colder elsewhere. This is more than compensated for by locations where the temperature rises more than the average.
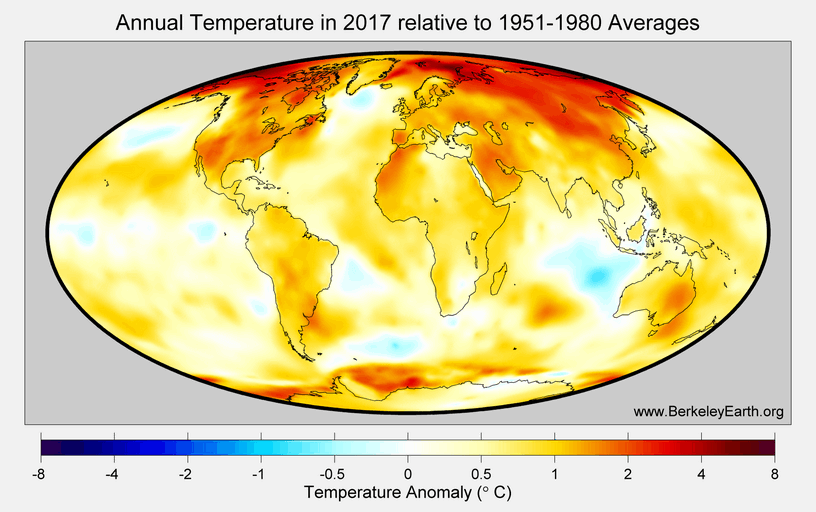
An excellent tool for the comparison of global temperature levels on a world map for individual time spans is provided by the NASA Goddard Institute for Space Studies.
Can solar activity cause global warming?
You can only come up with this idea if you look at the data from 1880 to 1960 in isolation. In addition, the strong cycles in the 18th and 19th centuries had no global effect (so "Global temperatures over the past 1700 years").
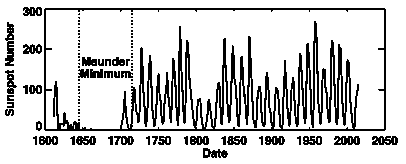
A recalibration of the sunspot statistics in 2015 put that the high value of 1954 into perspective. But even without this reassessment, solar activity has decreased since then. The last cycle in 2015 was extremely weak. Climate change skeptics therefore predict a new cold period. After the record year 2016 with the El Nino phenomenon occurring about every 4 years, 2017 and 2018 were somewhat less intense globally. However, the temperature levels remain historically high.
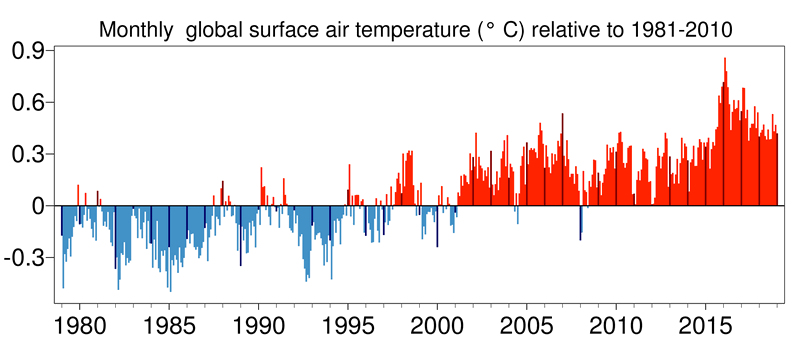
Does CO2 have any significant impact on the climate at all?
With the help of ice cores from the Antarctic, the amount of CO2 in the atmosphere can be determined. The current value of approx. 420 ppm is a clear all-time high of the past 800,000 years. Peak values never exceeded 300 ppm. Before that, the data is more speculative since there is no such old ice. According to the Royal Society, the value of 1000 ppm could have been reached 50 million years ago, with global warming about 10 degrees higher than today.
Why are a few degrees so dramatic?
Temperature do not rise evenly. The entire climate system can change. Take a look at Magadan (Siberia, Russia) and Stavanger (Norway). They are at about the same latitude, both at the coast, but the climate is fundamentally different. Magadan has mean winter temperatures of -15 ° C, Stavanger of + 2 ° C. Air and water currents have an enormous impact. Once they change, the process cannot be reverted. It is difficult to predict when and how this will happen. The melting of glaciers and polar caps has already started.
A global concept
There is no use if only a few countries start an energy transition - and even those with brakes on. All nations have to be at one table. A global energy transition does not mean industrial standstill, as is often claimed, but the opposite. It would be rational to expand grids, PV and wind plants with all available means - a gigantic investment program. The expansion must begin immediately. Unfortunately, 30 crucial years have been wasted on climate change.
Countries like Russia, the USA or Brazil can probably only be brought on board if they have the chance of future income from energy exports. The key to this could be a globalized electricity market with a massive expansion of the international power grid.
Since it would not be possible to prevent fossil-based electricity or nuclear energy from being fed into such a system, renewables would have to score by the price. CO2 emissions trading and a worldwide carbon tax would contribute to this. Mass production will PV and wind even cheaper. Manufacturing and grid costs can theoretically be as low as 2 to 4 cents / KWh are possible with long-term calculation. With a convincing concept, private capital in the billions could be raised for the investment costs.


